Debugging JavaScript code can be a frustrating experience, but VS Code’s “Debugger for Chrome” extension simplifies the process significantly. This powerful tool allows you to debug your front-end JavaScript code directly within VS Code, offering a seamless and efficient workflow. This article will guide you through the steps of setting up and effectively using the Debugger for Chrome extension in VS Code.
Setting Up Debugger for Chrome
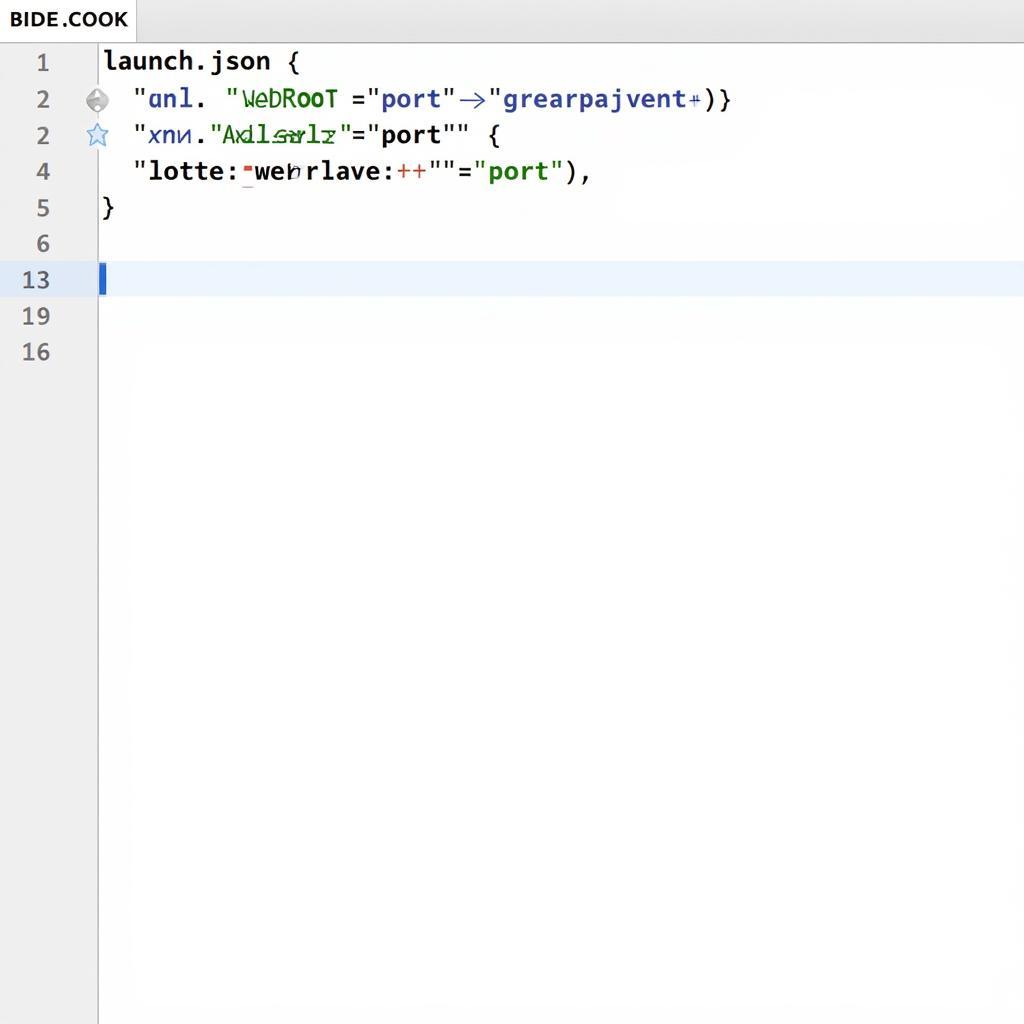
First, you’ll need to install the “Debugger for Chrome” extension from the VS Code Marketplace. Simply search for “Debugger for Chrome” and click install. Once installed, you need to configure VS Code to use the debugger. This is done by creating a launch configuration file (launch.json). Navigate to the Run and Debug view in VS Code (Ctrl+Shift+D or Cmd+Shift+D) and click “create a launch.json file.” Select “Chrome” from the environment selection list. This will generate a launch.json file with a pre-configured setting for launching Chrome.
Configuring launch.json
The default configuration usually works well, but you might need to adjust it depending on your project setup. The most important attribute is url, which specifies the URL to open in Chrome. Ensure this points to your application’s starting point, for example, http://localhost:3000 or the path to your index.html file. You can also specify a specific port if your application runs on a port other than the default.
 Cấu hình launch.json cho Debugger for Chrome
Starting a Debugging Session
Now you’re ready to start debugging! Set breakpoints in your JavaScript code by clicking in the gutter next to the line numbers. Then, select the appropriate launch configuration from the dropdown in the Run and Debug view and click the play button (or press F5). This will launch Chrome and open the specified URL. As your code executes and hits a breakpoint, VS Code will pause execution, allowing you to inspect variables, step through the code, and evaluate expressions.
Advanced Debugging Techniques
Beyond basic breakpoints, Debugger for Chrome offers advanced features. Conditional breakpoints allow you to pause execution only when a specific condition is met. Logpoints enable you to print information to the console without adding console.log statements. You can also use the “Call Stack” pane to see the sequence of function calls leading to the current breakpoint and the “Variables” pane to inspect the values of variables.
Troubleshooting Common Issues
Sometimes, you might encounter issues like breakpoints not being hit. Ensure that your source maps are configured correctly, especially if you’re using a build process that transpiles your code. Also, check your launch.json configuration, making sure the webRoot attribute correctly points to your project’s root directory.
“Having a robust debugging setup is crucial for any developer. Debugger for Chrome in VS Code is a game-changer, providing a powerful and integrated debugging experience.” – Nguyễn Văn A, Senior Front-End Developer
“Using Debugger for Chrome has significantly improved my productivity. I can quickly identify and fix bugs, leading to faster development cycles.” – Trần Thị B, Software Engineer
In conclusion, the Debugger for Chrome extension in VS Code is an invaluable tool for front-end developers. By understanding its setup and features, you can streamline your debugging workflow and improve your code quality. This guide covered How To Use Debugger For Chrome In Vs Code, from basic setup to advanced techniques and troubleshooting.
FAQ
- How do I install Debugger for Chrome? Search for “Debugger for Chrome” in the VS Code extensions marketplace and click install.
- What is launch.json? It’s a configuration file that tells VS Code how to launch your application for debugging.
- How do I set a breakpoint? Click in the gutter next to the line number in your JavaScript code.
- What are conditional breakpoints? Breakpoints that pause execution only when a specific condition is met.
- What are logpoints? A way to print information to the console without adding
console.logstatements. - Why are my breakpoints not being hit? Check your source maps and
webRootconfiguration in launch.json. - Where can I find more information about Debugger for Chrome? Consult the official VS Code documentation.
Mô tả các tình huống thường gặp câu hỏi
Một tình huống thường gặp là breakpoint không hoạt động. Điều này có thể do source map chưa được cấu hình đúng hoặc đường dẫn trong launch.json chưa chính xác. Kiểm tra lại các cài đặt này để đảm bảo breakpoint hoạt động.
Gợi ý các câu hỏi khác, bài viết khác có trong web.
Bạn có thể tìm hiểu thêm về các công cụ debug khác trong VS Code hoặc tìm hiểu về các kỹ thuật debug nâng cao trên website của chúng tôi.